Using Debug Mode
The Flute CMS debug system helps quickly identify and fix errors on your website. When issues occur (HTTP 500, blank pages, unexpected behavior), debug mode provides detailed information about the causes of failures.
What debug mode provides:
- Instead of standard error pages, you will see a detailed description of the problem: the file, the line of code, and the call stack
- A Tracy Bar will appear at the bottom of every page — a developer panel with information about load time, SQL queries, memory usage, and much more
- Error logs will be recorded in maximum detail
When to use:
- The site shows a blank page or a 500 error
- Something is not working as expected (for example, settings are not being saved, pages are not loading)
- You are developing or testing a module/theme
Debug mode should only be used during development or testing. On a production site, debug mode can expose sensitive information (file paths, SQL queries, environment variables) to visitors.
Enabling via the Admin Panel
Full debugging for all users
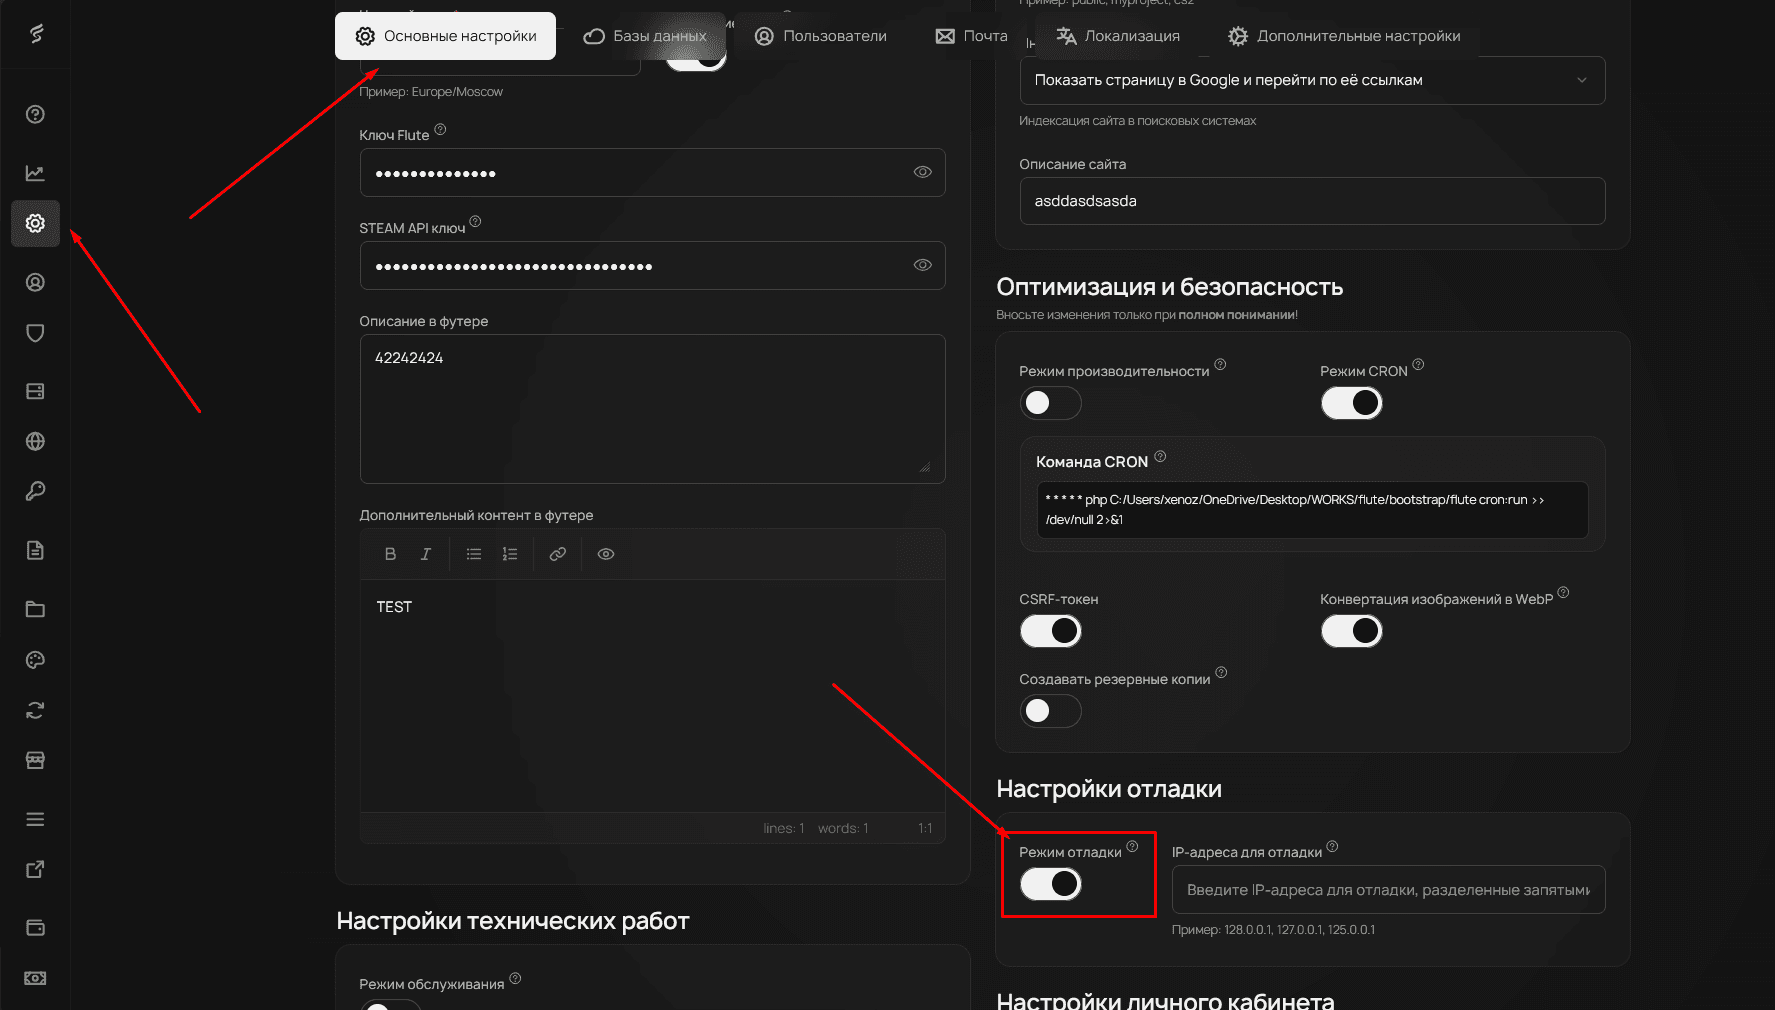
- In the admin panel sidebar, under the “General” section, click on “General Settings”
- You will be on the “General Settings” tab
- Scroll down to the “Debug Settings” section
- Enable the “Debug Mode” toggle
- Save the settings
After saving, debug information will be displayed for all site visitors.
Debugging for specific IP addresses
For safe testing on a production site, use the IP address restriction feature. In the same “Debug Settings” section, find the “IP Addresses for Debugging” field and enter the addresses separated by commas for which debugging will be active.
To find out your IP address, use an IP lookup service or check the Tracy Bar after enabling debug mode.
Examples of specifying IP addresses:
- Single address:
192.168.1.100 - Multiple addresses:
192.168.1.100, 10.0.0.5, 203.0.113.42
Enabling via the Configuration File
Direct configuration editing
If the admin panel is inaccessible due to critical errors, you can enable debug mode directly through the settings file.
Open the file configs/app.php in a text editor and find the line with the debug parameter. Change the value to true:
'debug' => true,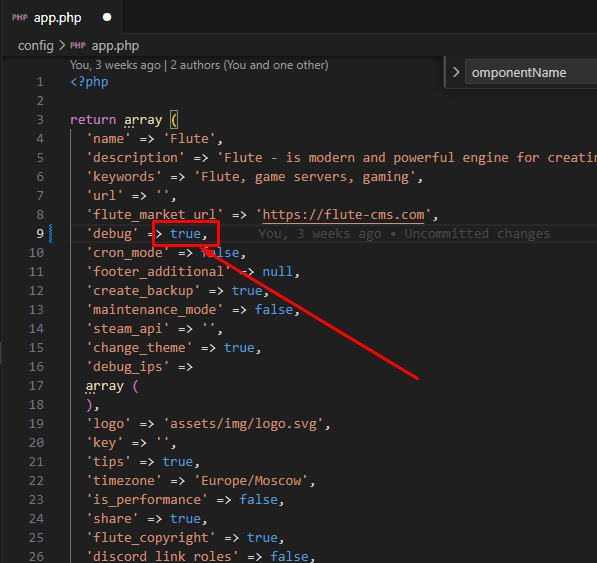
After resolving the issues, be sure to set the debug value back to false to ensure site security.
Analyzing Error Information
Critical errors
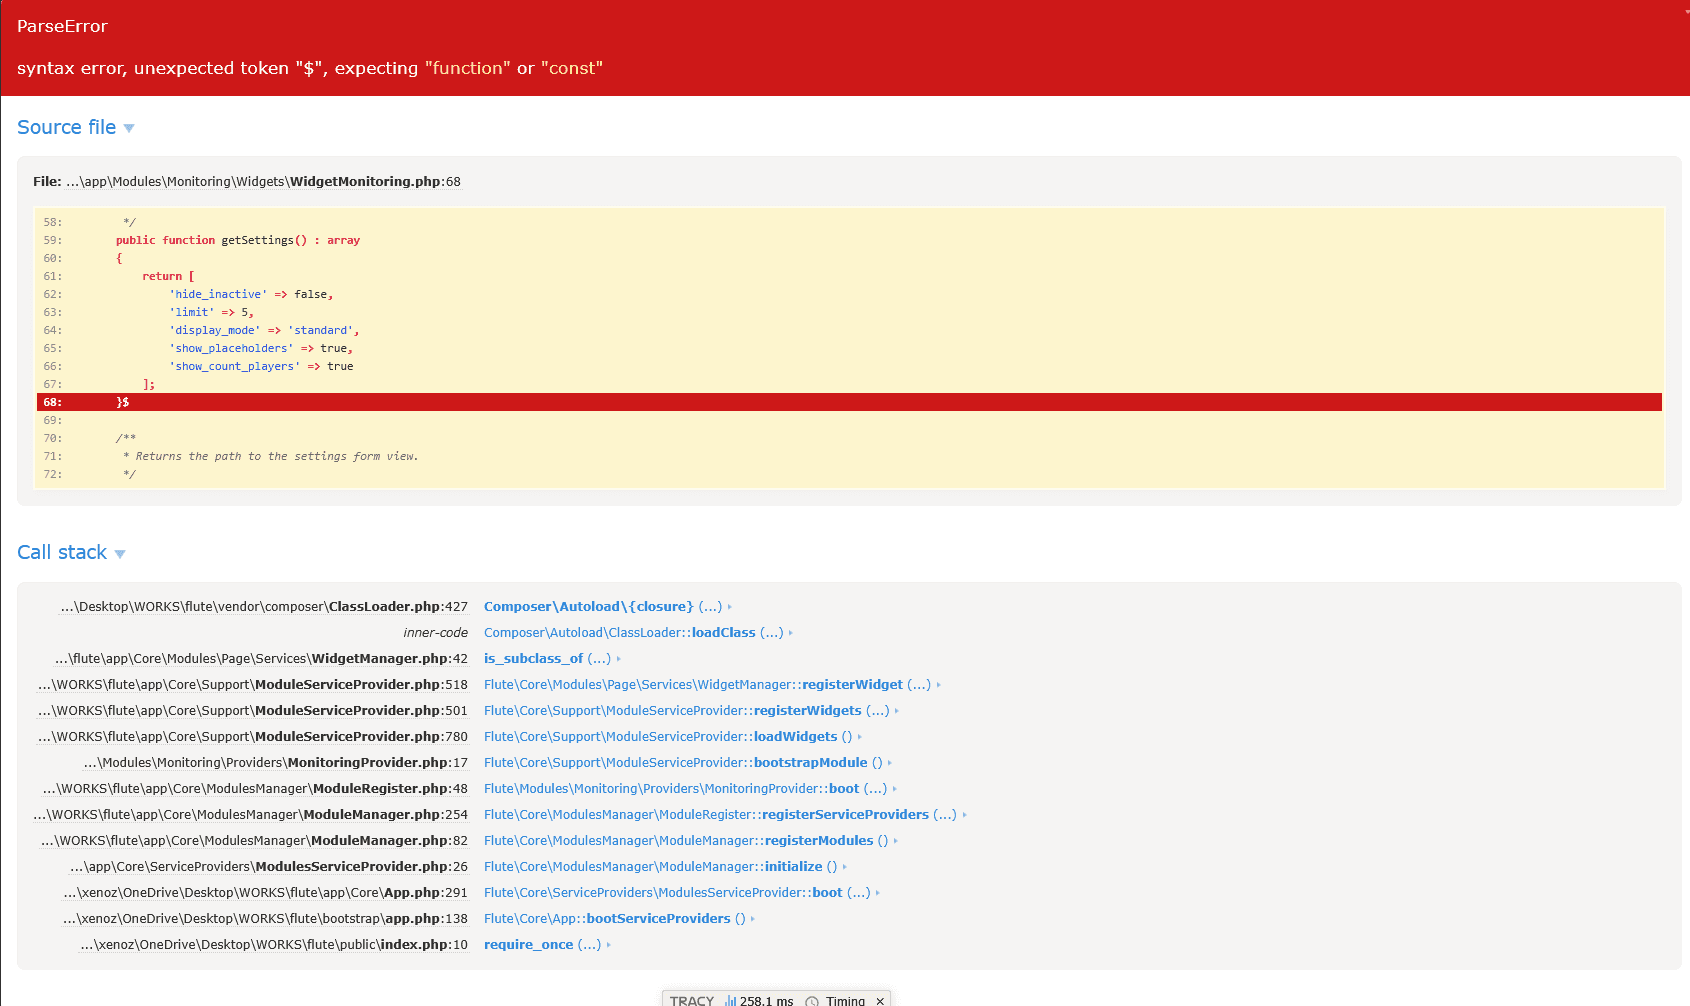
When serious problems occur, the debugger displays detailed information in a full-screen view:
- Error type — the category of the problem (syntax, logic, system)
- Message — a description of the specific problem
- File and line — the exact location of the error in the code
- Call stack — the sequence of function calls leading up to the error
- Variables — the values of variables at the time the error occurred
Tracy Bar — Developer Panel
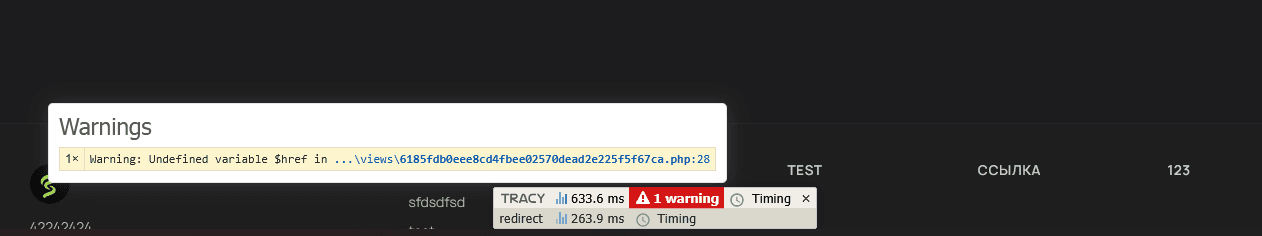
When debug mode is enabled, a Tracy Bar appears at the bottom of every page — a special panel with technical information. It shows:
- Page load time — how many milliseconds the page generation took
- Memory usage — the amount of RAM required to process the request
- SQL queries — a list of all database queries, their count, and execution time
- Warnings — minor errors and warnings that do not cause crashes but may indicate potential issues
- Your IP address — useful if you need to find out your IP for setting up IP-based debugging
By clicking on individual Tracy Bar tabs, you can expand detailed information for each section.
Tracy Bar does not affect the site experience for regular visitors if debugging is restricted by IP addresses. Studying Tracy Bar data will help you better understand how the system works and find performance bottlenecks.
Practical Debugging Tips
Common causes of errors
Database errors — check the connection settings in configs/database.php and the availability of the database server.
Permission issues — make sure the web server has write permissions to the storage, cache, and logs directories.
Plugin conflicts — temporarily disable recently installed extensions to identify the problematic component.
Insufficient memory — increase the PHP memory limit in the server settings or the .htaccess file.
Error logging
Flute CMS automatically saves error information to log files. You can find them in the storage/logs/ directory. These files are useful for analyzing problems that occurred earlier.
Clearing the cache
If the site behaves unexpectedly, try clearing the cache through the admin panel or by deleting the contents of the storage/app/cache/ directory.
Keep a changelog of modifications to your site. This will help quickly determine what actions led to the problem.